Three constant budgets, one common set of dates
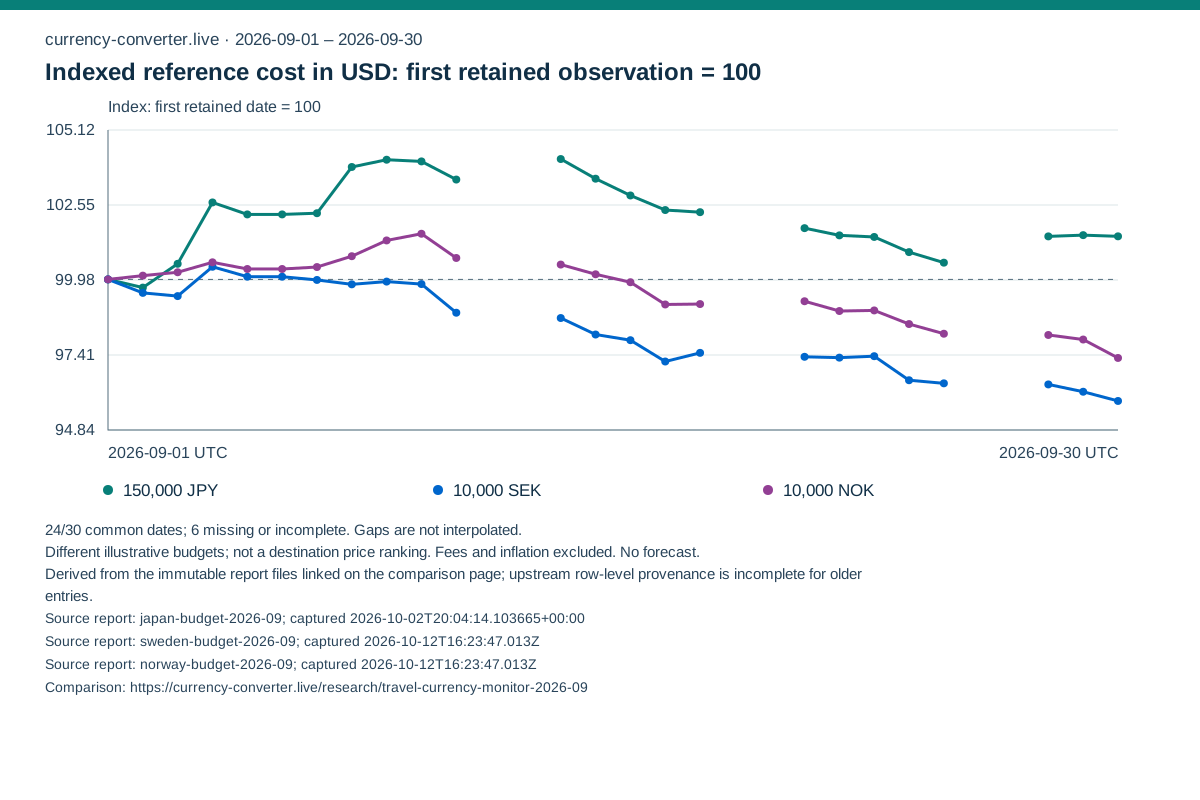
We reuse the published JPY 150,000, SEK 10,000 and NOK 10,000 scenarios. These are separate illustrative amounts still to be paid, not equivalent holidays or measured travel prices. Spending is held constant; fees, paid bookings, reserves and inflation are excluded.
What the comparison covers
24 common complete UTC dates out of 30 calendar dates (2026-09-01 to 2026-09-30); 6 dates are missing or incomplete. First retained date: 2026-09-01. Last retained date: 2026-09-30. Longest interval between retained dates: 3 calendar days.
Positive change means the same native-currency amount cost more in the selected home currency at the last retained observation than at the first. Negative change means it cost less. The comparison measures the currency effect on each fixed amount; it does not rank the affordability of Japan, Sweden or Norway.
| Fixed illustrative amount | First retained cost | Last retained cost | First-to-last change | Change (%) | Lowest sampled cost | Highest sampled cost |
|---|---|---|---|---|---|---|
| 150,000 JPY | 938.96 USD2026-09-01 UTC | 952.82 USD2026-09-30 UTC | 13.87 USD | 1.48% | 936.32 USD2026-09-02 UTC | 977.71 USD2026-09-14 UTC |
| 10,000.00 SEK | 1,044.18 USD2026-09-01 UTC | 1,000.66 USD2026-09-30 UTC | -43.53 USD | -4.17% | 1,000.66 USD2026-09-30 UTC | 1,048.71 USD2026-09-04 UTC |
| 10,000.00 NOK | 1,070.54 USD2026-09-01 UTC | 1,041.70 USD2026-09-30 UTC | -28.84 USD | -2.69% | 1,041.70 USD2026-09-30 UTC | 1,087.29 USD2026-09-10 UTC |
Percentage changes allow the movement of different fixed amounts to be compared. A larger absolute cost does not mean a more expensive destination. First-to-last change is distinct from the sampled low-to-high range.
Download and reproduce
The CSV includes all three home currencies and every common retained date, with unrounded calculated values, the source report and its checksums. The chart uses the selected home currency.
SVG works without JavaScript. PNG is generated in this browser from the same SVG. Formatting rounds the display only.
Method and limits
Each source file is validated with the same rules as its original report. For each file we retain the latest archive row per completed UTC date, then keep only dates with complete positive values. We intersect the dates across all three scenarios and require the shared USD, EUR and GBP observations to agree. No missing date is filled.
For a native-currency amount B, reference cost in home currency H = B × archived USD value per native unit ÷ archived USD value per H unit. Index = 100 × that date’s reference cost ÷ the first common date’s cost. Percentage change = 100 × (last common cost ÷ first common cost − 1).
The captures combine earlier imported archive values and service snapshots. Full upstream provenance was not retained for every older row. A UTC archive date is a record label, not proof of an exact upstream quote time or a market close. Matching dates and shared home-currency values make the calculations reproducible; they do not turn independently captured files into simultaneous market quotes. Low and high describe retained samples only. No provider offer, actual payment, forecast or recommendation to time an exchange is implied.
Source captures and checksums
The original source checksum identifies the complete privately retained capture, not the smaller public JSON. The second checksum identifies the exact public file used for this comparison. The source endpoint can now contain newer data; reproduce this report from the unchanged JSON downloads.
Japan travel budget: how exchange rates changed a fixed yen budget in September 2026
Original capture: 2026-10-02T20:04:14.103665+00:00
SHA-256 of the original complete source capture
0cbfaa00170781d94889c6a29a98ee6c2ec5ef6b90da34a66c280656739bb5c8
SHA-256 of this public source JSON file
228302e8e7ab6527c89816cdd460cf10011f1ae93c8296e4b60fbad51b1db0e1
Sweden travel budget: SEK 10,000 in September 2026
Original capture: 2026-10-12T16:23:47.013Z
SHA-256 of the original complete source capture
d6f3dd93a301a5c3f65a6f86cdfc0265b657bbdfec3efbf7a8321a192095ba2c
SHA-256 of this public source JSON file
daf874015a8872d1b3e2f959b8a4178c98448dbd11d17af7366c1ab64cf0db71
Norway travel budget: NOK 10,000 in September 2026
Original capture: 2026-10-12T16:23:47.013Z
SHA-256 of the original complete source capture
d6f3dd93a301a5c3f65a6f86cdfc0265b657bbdfec3efbf7a8321a192095ba2c
SHA-256 of this public source JSON file
daf874015a8872d1b3e2f959b8a4178c98448dbd11d17af7366c1ab64cf0db71